Fortuna delivers robust PEA for Diamba Sud Gold Project in Senegal: After-tax IRR of 72% and NPV5% of US$563 million using US$2,750 per ounce
(All financial information contained herein are expressed in US dollars unless otherwise stated)
VANCOUVER, British Columbia, Oct. 15, 2025 (GLOBE NEWSWIRE) -- Fortuna Mining Corp. (NYSE: FSM | TSX: FVI) is pleased to report the results of the Preliminary Economic Assessment (PEA) prepared for the Diamba Sud Gold Project in Senegal.
The PEA supports robust project economics for the development of an open-pit mine and conventional carbon-in-leach (CIL) processing plant. At a gold price of $2,750 per ounce, the assessment unveils an after-tax NPV5% of $563 million, an IRR of 72 percent, and a payback period of ten months. During the first three years of production, Diamba Sud is projected to deliver an average of 147,000 ounces of gold per year at an All-In Sustaining Cost1 (AISC) of $904 per ounce.
Construction capital cost is estimated at approximately $283.2 million. Project funding is derisked by the strength of Fortuna’s balance sheet and robust cash flow generation. As of the end of the second quarter of 2025, Fortuna reported liquidity of $537.3 million and a net cash position of $214.8 million.
Jorge A. Ganoza, President and CEO at Fortuna, commented, “The PEA highlights the strong value Diamba Sud brings to Fortuna’s portfolio, using a long-term gold price of $2,750 per ounce. With permitting and the Definitive Feasibility Study underway, we expect to make a construction decision in the first half of 2026.” Mr. Ganoza continued, “Ongoing exploration is advancing with five drill rigs focused on expanding open areas of mineralization and to upgrade the small portion of Inferred Mineral Resources to the Measured and Indicated categories by year-end. With continued exploration success, we expect to enhance Diamba Sud’s life of mine production profile beyond a decade.” Mr. Ganoza concluded, “Additionally, we have approved a $17 million budget to advance early construction works, including the expansion of camp and ancillary facilities, as well as detailed engineering activities.”
Note:
- This is a non-GAAP financial measure. The definition and purpose of this non-GAAP financial measure is included under the heading “Cautionary Note on Non-GAAP Measures” in this news release.
PEA Key Highlights
Table 1 summarizes the key assumptions, operational parameters, economic results, and AISC values from the PEA.
Table 1: PEA key highlights
| Metrics | Units | Results |
||
| Gold price | $/oz | 2,750 | ||
| Life of mine | year | 8.1 | ||
| Total mineralized material mined1 | Mt | 17.75 | ||
| Contained gold in mined resource1 | koz | 932 | ||
| Strip ratio | w:o | 5.5:1 | ||
| Throughput initial 3 years (oxide) | Mtpa | 2.5 | ||
| Throughput @ nameplate (fresh) | Mtpa | 2.0 | ||
| Head grade | g/t Au | 1.63 | ||
| Recoveries | % | 90% | ||
| Gold production | ||||
| Total Production over LOM | koz | 840 | ||
| Average annual production, LOM | koz | 106 | ||
| Average annual production, first 3 years | koz | 147 | ||
| Per unit costs over LOM | ||||
| Total mining costs | $/t, mined | $4.82 | ||
| Processing | $/t, processed | $13.91 | ||
| G&A | $/t, processed | $6.70 | ||
| Cash costs1 | ||||
| Average operating cash costs2, LOM | $/oz | $1,081 | ||
| Average operating cash costs2, first 3 years | $/oz | $759 | ||
| AISC1 | ||||
| Average AISC2, LOM | $/oz | $1,238 | ||
| Average AISC2, first 3 years | $/oz | $904 | ||
| Capital costs | ||||
| Initial capital expenditure | $ M | $283 | ||
| Sustaining capital, operations + Infrastructure (includes closure costs) | $ M | $48 | ||
| NPV5%, pre-tax (100% project basis) | $M | $772 | ||
| Pre-tax IRR | % | 86% | ||
| NPV5%, after-tax (100% project basis) | $M | $563 | ||
| After-tax IRR | % | 72% | ||
| Payback period | year | 0.8 | ||
| Annual EBITDA 2 | ||||
| Average EBITDA2 over LOM | $ M | $167 | ||
| Average EBITDA2 over first 3 years | $ M | $277 | ||
Notes:
- The pit optimization shells used for the mining inventory were generated using a gold price of $2,300 per ounce.
- This is a non-GAAP financial measure. The definition and purpose of this non-GAAP financial measure is included under the heading “Cautionary Note on Non-GAAP Measures” in this news release. Non-GAAP financial measures have no standardized meaning under IFRS and therefore, may not be comparable to similar measures presented by other issuers.
- Average operating cash costs and average AISC represent costs for projected production for the LOM at the time of gold sales.
- The PEA is presented on a 100 percent project basis. However, upon the granting of the exploitation permit, the Senegalese Government will be entitled to a 10 percent free-carried interest in the Project, with the right for the State to acquire an additional contributory interest of up to 25 percent.
- The economic analysis was carried out using a discounted cash flow approach on a pre-tax and after-tax basis, based on the gold price of $2,750/oz.
- The IRR on total investment that is presented in the economic analysis was calculated assuming a 100% ownership in Diamba Sud.
- The NPV was calculated from the after-tax cash flow generated by the Project, based on a discounted rate of 5% and an effective date of October 10, 2025.
- The PEA assumes that the percentage of certain royalties and taxes payable to the State, the percentage of the investment tax credit available to the company and the percentage payable to the social development fund will be in accordance with the provisions of the Mining Convention between Boya S.A. and the State of Senegal dated April 8, 2015. There can be no assurance that such provisions will not be renegotiated by the State as part of the exploitation permit approval process.
- The PEA is preliminary in nature, and it includes inferred mineral resources that are considered too speculative geologically to have the economic considerations applied to them that would enable them to be categorized as mineral reserves, and, as such, there is no certainty that the PEA results will be realized.
Exploration Upside: Resource Delineation and Exploration Drilling
Opportunities exist to further strengthen and enhance Diamba Sud’s economic foundation through continued drilling, resource extension testing, and definition of new targets. Successful exploration programs are expected to extend the Life of Mine (LOM) gold production profile to beyond a decade.
Exploration drilling completed since the data cut-off for the Mineral Resource estimate in the PEA comprises 125 drill holes totaling 15,794 meters. Results from this recent drilling include drill hole DSDD488 that intersected 22.7 g/t Au over an estimated true width of 21.6 meters, highlighting substantial exploration upside (refer to Fortuna news release dated August 13, 2025: “Fortuna drills 22.7 g/t gold over 21.6 meters at Southern Arc, Diamba Sud Gold Project, Senegal”).
Exploration programs for the second half of 2025 are focused on:
- Infill drilling at Area A, Area D, Karakara, Moungoundi, and Southern Arc to convert Inferred Resources to Indicated Resources in support of the forthcoming Definitive Feasibility Study (DFS) and Mineral Reserve estimate.
- Step-out and resource expansion drilling at Southern Arc aimed at increasing the Mineral Resource and enhancing the LOM gold-production profile from year four onward.
- Testing prospective targets identified across the broader Diamba Sud tenement package, which offer additional growth potential.
- Continuing exploration at Fortuna’s Bondala properties, adjacent to Diamba Sud, where geophysical surveys and auger drilling have identified anomalies to be followed up with targeted drill programs.
Diamba Sud PEA Overview
The PEA outlines the design of an open pit gold mining operation targeting a series of deposits including Area A, Area D, Karakara, Western Splay, Kassassoko, Moungoundi, and Southern Arc which will feed a central gold processing facility over the current 8.1-year LOM. The assessment is based on Diamba Sud´s Mineral Resource estimate, which comprises an Indicated Mineral Resource of 14.2 million tonnes (Mt) at an average gold grade of 1.59 grams per tonne (g/t), containing 724,000 ounces of gold, and an Inferred Mineral Resource of 6.2 Mt at an average grade of 1.44 g/t gold, containing 285,000 ounces of gold, reported as of July 7, 2025 (refer to Fortuna news release dated August 5, 2025, “Fortuna Advances Diamba Sud Gold Project in Senegal with Updated Mineral Resources; PEA Completion Targeted for Q4 2025”).
Mining and Processing
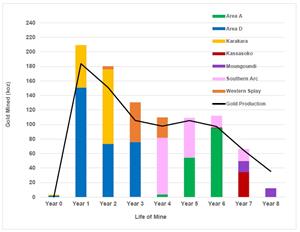
The PEA and mine plan outline the design of an open pit gold mining operation feeding a central gold processing facility over the 8.1-year LOM. The assessment anticipates the concurrent development of multiple deposits, including Area A, Area D, Karakara, Western Splay, Kassassoko, Moungoundi, and Southern Arc, with no more than three pits mined at any one time (refer to Figure 1).
The production strategy targets an initial throughput of 2.5 million tonnes per annum (Mtpa) during the first three years of operation, supported by the high oxide content at Area D, before transitioning to a sustained rate of 2.0 Mtpa from year four onward as the feed becomes predominantly fresh material.
Exploration drilling completed at the Southern Arc deposit subsequent to the Mineral Resource estimate in the PEA has intersected near-surface mineralization to the south and east of the currently defined pit limits. It is anticipated that these results will be incorporated in future evaluations to enhance gold production in the later years of the LOM.
The pit optimization shells used to define the mining inventory were generated using a gold price of $2,300 per ounce and a revenue factor of 1.0. Optimization parameters incorporated government royalties, refining, mining, processing, and general and administrative costs to ensure realistic pit designs and economic assumptions.

Figure 1: Diamba Sud PEA Production Profile: Annual gold production profile over the projected LOM, highlighting the contribution from individual deposits and the transition from oxide to fresh material.
Mining activities at Diamba Sud will employ conventional open pit methods. Drilling and blasting are planned for both oxide and fresh mineralized material, followed by conventional truck-and-shovel operations for the movement of potentially mineralized material and waste within the pits.
The Diamba Sud process plant design is based on a metallurgical flowsheet developed to produce gold doré at optimum recovery while minimizing initial capital and operating costs. The flowsheet comprises conventional crushing, milling (single-stage semi-autogenous grinding mill in closed circuit with cyclones), gravity recovery, carbon-in-leach processing, carbon elution, and gold recovery.
A summary of the key operating and production statistics from the PEA is presented in Table 2.
Table 2: Diamba Sud LOM Mining and Processing Plan Metrics
| Unit | Year -1 | Year 0 | Year 1 | Year 2 | Year 3 | Year 4 | Year 5 | Year 6 | Year 7 | Year 8 | LOM | |
| Area A | ||||||||||||
| Potentially mineralized material mined | kt | 9 | 122 | 923 | 2,044 | 3,098 | ||||||
| Au grade | g/t | 1.17 | 0.97 | 1.84 | 1.45 | 1.54 | ||||||
| Area D | ||||||||||||
| Potentially mineralized material mined | kt | 69 | 1,870 | 1,718 | 1,666 | 5,323 | ||||||
| Au grade | g/t | 0.87 | 2.51 | 1.33 | 1.41 | 1.76 | ||||||
| Karakara | ||||||||||||
| Potentially mineralized material mined | kt | 21 | 974 | 1,745 | 2,741 | |||||||
| Au grade | g/t | 1.97 | 1.87 | 1.83 | 1.84 | |||||||
| Kassassoko | ||||||||||||
| Potentially mineralized material mined | kt | - | 30 | 1,099 | 1,130 | |||||||
| Au grade | g/t | - | 1.04 | 0.97 | 0.97 | |||||||
| Moungoundi | 34.3 | |||||||||||
| Potentially mineralized material mined | kt | 499 | 296 | 795 | ||||||||
| Au grade | g/t | 0.95 | 1.28 | 1.07 | ||||||||
| Southern Arc | 15.2 | |||||||||||
| Potentially mineralized material mined | kt | 0 | 1,532 | 1,008 | 299 | 264 | 3,103 | |||||
| Au grade | g/t | 0.47 | 1.58 | 1.68 | 1.65 | 1.98 | 1.65 | |||||
| Western Splay | 16.8 | |||||||||||
| Potentially mineralized material mined | kt | 121 | 1,172 | 270 | 1,564 | |||||||
| Au grade | g/t | 1.12 | 1.45 | 3.22 | 1.73 | |||||||
| Total | ||||||||||||
| Potentially mineralized material mined | kt | 90 | 2,845 | 3,585 | 2,847 | 1,925 | 1,931 | 2,373 | 1,862 | 296 | 17,754 | |
| Au grade | g/t | 1.13 | 2.29 | 1.56 | 1.43 | 1.77 | 1.76 | 1.47 | 1.11 | 1.28 | 1.63 | |
| Contained gold | koz | 3.3 | 209.4 | 180.3 | 130.5 | 109.6 | 109.0 | 111.9 | 66.3 | 12.2 | 932.4 | |
| Waste mined | kt | 2,322 | 16,326 | 15,588 | 16,380 | 17,166 | 13,793 | 7,264 | 7,597 | 656 | 97,092 | |
| Total mined | kt | 2,412 | 19,171 | 19,173 | 19,228 | 19,091 | 15,723 | 9,637 | 9,459 | 953 | 114,846 | |
| Stockpile | ||||||||||||
| Start of period | kt | 90 | 580 | 1,665 | 2,013 | 1,712 | 1,532 | 1,875 | 1,524 | n/a | ||
| Grade | g/t | 1.13 | 0.76 | 0.57 | 0.59 | 0.68 | 0.59 | 0.59 | 0.58 | n/a | ||
| Processing | ||||||||||||
| Material milled | kt | 2,354 | 2,500 | 2,500 | 2,225 | 2,111 | 2,030 | 2,213 | 1,821 | 17,754 | ||
| Head grade | g/t | 2.62 | 2.04 | 1.53 | 1.55 | 1.72 | 1.62 | 1.03 | 0.70 | 1.63 | ||
| Contained gold | koz | 198.5 | 163.8 | 122.7 | 110.8 | 117.0 | 105.7 | 73.2 | 40.7 | 932.4 | ||
| Recovery | % | 92.5 | 92.1 | 86.1 | 88.2 | 90.0 | 91.9 | 87.9 | 86.6 | 90.1 | ||
| Gold production | koz | 183.7 | 150.9 | 105.6 | 97.7 | 105.3 | 97.2 | 64.3 | 35.3 | 840 |
Tailings, Water and Power
The tailings management system will comprise a tailings pipeline and a water return pipeline housed within a geomembrane-lined trench, with associated tailings pumps. The Tailings Storage Facility (TSF) will be fully lined with a geomembrane and will be developed as a side-valley storage facility formed by robust, multi-zoned earth-fill embankments. It is designed to accommodate 17.8 Mt of tailings and will be constructed using the downstream methodology, in accordance with industry best practices and the Global Industry Standard on Tailings Management (GISTM).
A water storage dam will serve as the main collection and storage facility for clean, raw, and process water. Raw water is currently assumed to be supplied via a pipeline from the Falémé River, supplemented by pit dewatering activities. Ongoing studies are evaluating the potential to develop a water harvesting facility as an alternative source. Process water from the TSF will be recycled back to the plant, with site operations designed as a closed-circuit system to maximize water reuse and minimize environmental impacts on surrounding communities.
Power for Diamba Sud is expected to be self-supplied through an on-site power plant. The current plan envisages a heavy fuel oil power plant constructed in an N+1 configuration, supported by light fuel oil generators to meet site-wide demand. In parallel, a hybrid solar photovoltaic system is being evaluated as part of the preparation of the DFS.
Capital Costs Summary
The PEA estimates the total initial capital required to develop Diamba Sud to be $283.2 million, including $4.0 million in capitalized closure costs to be deposited into escrow and a $46.4 million contingency. Sustaining capital is estimated at an additional $40.0 million, directly related to mining operations, processing, and infrastructure sustaining capital, along with a further $8.0 million in closure costs over the 8.1-year LOM.
Mining pre-production capital includes all mining activities required prior to commissioning of the processing facility. A total of 2.3 Mt of waste and 90 kt of potentially mineralized material will be mined to establish a stockpile ahead of processing operations. All contractor mobilization and setup costs are included in the pre-production capital allowance.
The processing plant capital estimate relates to a facility with a nameplate throughput of 2.0 Mtpa, designed to accommodate up to 2.5 Mtpa. The capital cost estimate is based on an Engineering, Procurement, Construction, and Management (EPCM) implementation approach.
A summary of estimated capital costs is presented in Table 3, and the estimated annual sustaining capital costs are set out in Table 4.
Table 3: Summary of Initial Development Capital Costs
| Capital Costs | Value ($ M) | |
| Construction costs | $191.7 | |
| Pre-production costs (excluding mining) | $21.6 | |
| Mining pre-stripping | $19 | |
| Contingency | $46.4 | |
| Withholding taxes, duties, levies | $4.5 | |
| Total | $283.2 | |
Table 4: Estimated Annual Sustaining Capital Costs
|
Year |
Units |
Year | Year | Year | Year | Year | Year | Year | Year | Year | Year |
Total |
| 1 | 2 | 3 | 4 | 5 | 6 | 7 | 8 | 9 | 10 | |||
| TSF lifts | $ M | 4.5 | - | 7.3 | - | 11.7 | - | 11.1 | - | 34.6 | ||
| Roads | $ M | - | 2.1 | 0.2 | - | - | 0.1 | 0.3 | - | 2.7 | ||
| Surface water management | $ M | - | 1.0 | 0.9 | - | - | - | 0.3 | - | 2.3 | ||
| Closure | $ M | - | - | 0.6 | 0.6 | 0.6 | 0.6 | 0.6 | 5.3 | 8.5 | ||
| Total | $ M | 4.5 | 3.1 | 9.1 | 0.6 | 12.3 | 0.7 | 12.4 | 5.3 | 48.0 |
Operating Costs Summary
The PEA estimates direct operating costs of $51.16 per tonne of material milled or $1,081 per ounce of gold produced, and AISC1 of $1,238 per ounce over the LOM, as summarized in Table 5.
Table 5: LOM AISC1
| $M | $/t milled | $/payable oz | |
| Operating cost | |||
| Mining | 542 | 30.54 | 646 |
| Processing | 247 | 13.91 | 294 |
| G&A | 119 | 6.70 | 142 |
| Subtotal, direct operating costs | 908 | 51.16 | 1,081 |
| Refining | 3 | 0.14 | 3 |
| Royalties2 | 69 | 3.90 | 83 |
| Social Development Fund2 | 12 | 0.65 | 14 |
| Total Operating Costs | 992 | 55.85 | 1,180 |
| Sustaining Capital, and Reclamation | |||
| Sustaining Capital | 40 | 2.23 | 47 |
| Closure | 8 | 0.48 | 10 |
| All-in Sustaining Cost1 | 1,040 | 58.56 | 1,238 |
Notes:
- AISC and cash costs per payable ounce of gold sold are non-GAAP financial measures; refer to “Cautionary Note on Non-GAAP Measures”
- The PEA assumes a 3% royalty payable to the State and 0.5% contribution to a Social Development Fund
Financial Analysis
Diamba Sud has been evaluated on a discounted cash flow basis and the results of the PEA demonstrate that it is potentially economically robust. The base case, using a gold price of $2,750 per ounce, generates an after-tax NPV at a 5 percent discount rate of $563 million, an IRR of 72 percent, and a payback period of approximately ten months. Figure 2 illustrates the estimated cash flow profile of Diamba Sud over the LOM.
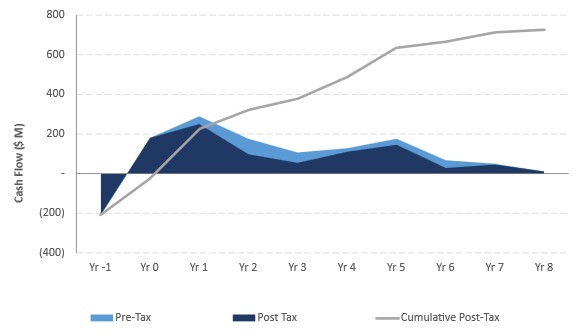
Figure 2: Diamba Sud Cash Flow Profile
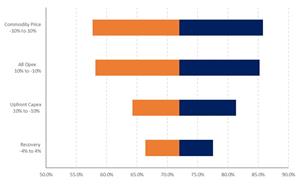
Sensitivity Analysis: Strong economic performance across a range of key variables
Diamba Sud´s NPV and IRR are most sensitive to changes in revenue parameters, including gold price, head grade, and process plant recovery. NPV and IRR are more sensitive to variations in operating costs than to capital costs.
Estimated NPV sensitivities for key operating and economic metrics are presented in Figure 3.
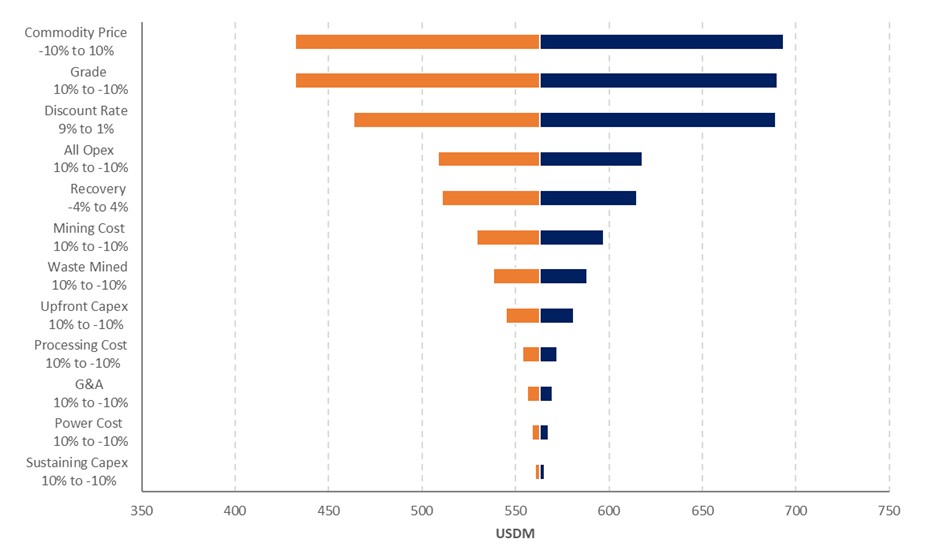
Figure 3: After-tax NPV5% Sensitivities
The sensitivity of Diamba Sud’s NPV to changes in the applied discount rate and gold price is presented in Table 5; base case highlighted.
Table 5: Gold Price and Discount Rate Sensitivities on Post-tax NPV ($ M)
| Gold Price ($/oz) | |||||||||||||||||
| $2,000 | $2,250 | $2,500 | $2,750 | $3,000 | $3,250 | $3,500 | $3,750 | ||||||||||
|
Discount Rate (%) |
3.0 | $230 | $362 | $494 | $622 | $750 | $878 | $1,007 | $1,134 | ||||||||
| 5.0 | $200 | $322 | $444 | $563 | $682 | $800 | $919 | $1,037 | |||||||||
| 7.0 | $173 | $287 | $400 | $511 | $621 | $731 | $841 | $951 | |||||||||
The sensitivity of Diamba Sud’s IRR to changes in the key operating parameters is illustrated in Figure 4.

Figure 4: Diamba Sud Post-Tax IRR sensitivities
Environmental and Permitting
On October 6, 2025, Fortuna filed an Environmental and Social Impact Assessment (ESIA) with the Direction de la Réglementation Environnementale et du Contrôle (DiREC), a division of the Ministry of the Environment and Sustainable Development of Senegal (refer to Fortuna news release dated October 7, 2025, “Fortuna Files Environmental and Social Impact Assessment for the Diamba Sud Gold Project in Senegal and provides update on Preliminary Economic Assessment status”). The filing of the ESIA marks an important milestone in the permitting process.
Fortuna expects to apply and receive an exploitation permit for Diamba Sud before the expiry of its exploration permit in June 2026.
Next Steps: Definitive Feasibility Study and Early Works
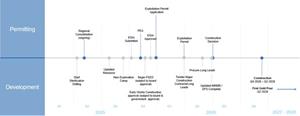
Fortuna has approved a supplementary budget of $17 million to de-risk Diamba Sud’s development schedule by advancing early work planning and permitting in parallel with early works construction activities to establish site access and a new accommodation camp. In addition, subject to Board approval, front-end engineering and design is scheduled to commence this quarter, followed by the procurement of long-lead items in the second quarter of 2026 to ensure readiness for project execution.
The DFS is expected to be completed towards the end of the second quarter of 2026, leading to an anticipated construction decision shortly thereafter. A positive construction decision would position Diamba Sud to begin full construction in the fourth quarter of 2026, following the wet season, with first gold pour targeted for the second quarter of 2028.
The projected timeline for development and key milestones is illustrated in Figure 5.
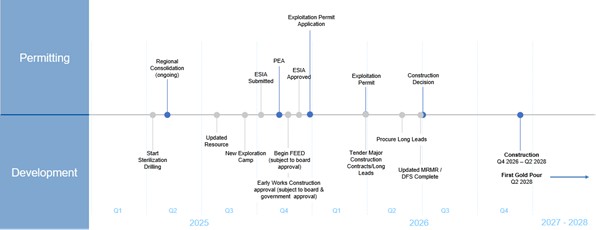
Figure 5: Diamba Sud Projected Development Timeline and Key Milestones
Technical Report
A technical report supporting the results of the PEA will be prepared in accordance with National Instrument 43-101, Standards of Disclosure for Mineral Projects and filed on SEDAR+ at www.sedarplus.com and on EDGAR at www.sec.gov/edgar under Fortuna Mining’s profile within 45 days of the date of this news release. The technical report will also be available on the Company’s website at www.fortunamining.com.
Further information regarding the PEA referenced in this news release, including details on data verification, key assumptions, parameters, opportunities, risks, and other factors, will be contained in the technical report.
The PEA is preliminary in nature, and it includes inferred mineral resources that are considered too speculative geologically to have the economic considerations applied to them that would enable them to be categorized as mineral reserves, and, as such, there is no certainty that the PEA results will be realized.
Qualified Person
Raul Espinoza, Director of Technical Services for the Company, is a Fellow member and Chartered Professional of the Australasian Institute of Mining and Metallurgy (FAusIMM CP) and a Qualified Person as defined by National Instrument 43-101, Standards of Disclosure for Mineral Projects. Mr. Espinoza has reviewed and approved the scientific and technical information pertaining to the Project contained in this news release and has verified the underlying data.
About Fortuna Mining Corp.
Fortuna Mining Corp. is a Canadian precious metals mining company with three operating mines and a portfolio of exploration projects in Argentina, Côte d’Ivoire, Mexico, and Peru, as well as the Diamba Sud Gold Project in Senegal. Sustainability is at the core of our operations and stakeholder relationships. We produce gold and silver while creating long-term shared value through efficient production, environmental stewardship, and social responsibility. For more information, please visit our website at www.fortunamining.com
ON BEHALF OF THE BOARD
Jorge A. Ganoza
President, CEO, and Director
Fortuna Mining Corp.
Investor Relations:
Carlos Baca | info@fmcmining.com | fortunamining.com | X | LinkedIn | YouTube
Cautionary Note Regarding Forward-Looking Statements
This news release contains forward-looking statements which constitute “forward-looking information” within the meaning of applicable Canadian securities legislation and “forward-looking statements” within the meaning of the “safe harbor” provisions of the Private Securities Litigation Reform Act of 1995 (collectively, “Forward-looking Statements”). All statements included herein, other than statements of historical fact, are Forward-looking Statements and are subject to a variety of known and unknown risks and uncertainties which could cause actual events or results to differ materially from those reflected in the Forward-looking Statements. Forward-looking statements contained in this news release include, without limitation, statements with respect to: the calculation of mineral resources at the Project and the possibility of eventual economic extraction of minerals from the Project; the identification of future mineral resources at the Project; the Company’s ability to convert existing mineral resources into categories of mineral resources or mineral reserves of increased geological confidence; the projected yearly gold production profile from both open pit and underground operations, all-in sustaining costs, mill throughput and average grades; future plans for exploration drilling; the projected economics of the project, including total gold sales, margins, taxes, average annual production, the net present value of the Project, the internal rate of return on the Project, project payback period, average yearly free cash flow, life of mine unit costs, projected mine life, the total initial capital and sustaining capital required; the project design, including the location of the tailings management facility, process plant, water storage dam, infrastructure area, stockpile areas, camp; and the proposed open pit mine plans; the plans for completing the early works program; the project development timeline to production including the Company’s work relating to its environmental impact assessment statement and obtaining the permit, the permitting of future phases of the Project, the timing of the completion of future studies including a feasibility study, obtaining an exploitation permit for the Project, other permitting approvals, and the development and construction of and production at the Project, including the constructing of a series of open pit mines; the timing of and future prospects for exploration and any expansion of the Project, including upside associated with the Project and the Company’s adjacent permits; the potential for expanding the initial mineral resource and the potential for identifying additional mineralization in areas of intercepts and conceptual areas for extension and expansion; potential recovery rates or processing techniques.
These statements are based on information currently available to the Company and the Company provides no assurance that actual results will meet management's expectations. In certain cases, forward-looking information may be identified by such terms as "anticipates", "believes", "could", "estimates", "expects", "may", "shall", "will", or "would". Forward-looking information contained in this news release is based on certain factors and assumptions regarding, among other things, the PEA, the estimation of Mineral Resources, the realization of resource estimates and mining inventory, any potential upgrades of existing resource estimates, gold metal prices, the timing and amount of future exploration and development expenditures, the estimation of initial and sustaining capital requirements, the estimation of labour and operating costs, the availability of necessary financing and materials to continue to explore and develop the Company’s properties in the short and long-term, the progress of exploration and development activities, the receipt of necessary regulatory approvals, and assumptions with respect to currency fluctuations, environmental risks, title disputes or claims, and other similar matters. The Company also notes that, under Senegalese mining legislation, the Government is entitled to a 10% free-carried interest and may elect to purchase up to an additional 25% interest in the project at a “fair price” determined through an independent valuation upon the granting of the exploitation permit. While the Company considers these assumptions to be reasonable based on information currently available to it, they may prove to be incorrect.
Although the Company believes the expectations expressed in such forward-looking statements are based on reasonable assumptions, such statements are not guarantees of future performance and actual results or developments may differ materially from those in the forward-looking statements. Factors that could cause actual results to differ materially from those in forward-looking statements include: changes in market conditions, unsuccessful exploration results, possibility of project cost overruns or unanticipated costs and expenses, changes in the costs and timing of the development of new deposits, inaccurate reserve and mining inventory estimates, changes in the price of gold, unanticipated changes in key management personnel and general economic conditions; the duration and impacts of geo-political uncertainties on the Company’s production, workforce, business, operations and financial condition; the expected trends in mineral prices, inflation and currency exchange rates; that all required approvals and permits will be obtained for the Company’s business and operations on acceptable terms; that there will be no significant disruptions affecting the Company’s operations. Mining exploration and development is an inherently risky business. Accordingly, actual events may differ materially from those projected in the forward-looking statements. This list is not exhaustive of the factors that may affect any of the Company's forward-looking statements, including the factors included in the Company’s annual information form for the year ended December 31, 2024. These and other factors should be considered carefully and readers should not place undue reliance on the Company's forward-looking statements. Forward-looking Statements are made as of the date hereof and the Company disclaims any obligation to update any Forward-looking Statements, whether as a result of new information, future events, or results or otherwise, except as required by law. There can be no assurance that these Forward-looking Statements will prove to be accurate, as actual results and future events could differ materially from those anticipated in such statements. Accordingly, investors should not place undue reliance on Forward-looking Statements
Cautionary Note to United States Investors Concerning Estimates of Reserves and Resources
Reserve and resource estimates included in this news release have been prepared in accordance with National Instrument 43-101 Standards of Disclosure for Mineral Projects (“NI 43-101”) and the Canadian Institute of Mining, Metallurgy, and Petroleum Definition Standards on Mineral Resources and Mineral Reserves. NI 43-101 is a rule developed by the Canadian Securities Administrators that establishes standards for public disclosure by a Canadian company of scientific and technical information concerning mineral projects. Unless otherwise indicated, all mineral reserve and mineral resource estimates contained in the technical disclosure have been prepared in accordance with NI 43-101 and the Canadian Institute of Mining, Metallurgy and Petroleum Definition Standards on Mineral Resources and Reserves.
Canadian standards, including NI 43-101, differ significantly from the requirements of the Securities and Exchange Commission, and mineral reserve and resource information included in this news release may not be comparable to similar information disclosed by U.S. companies.
Cautionary Note Regarding Non-GAAP Measures
This news release includes certain terms or performance measures commonly used in the mining industry that are not defined under International Financial Reporting Standards (“IFRS”), including EBITDA, cash costs and AISC per payable ounce of gold sold. Non-GAAP measures do not have any standardized meaning prescribed under IFRS and, therefore, they may not be comparable to similar measures employed by other companies. We believe that, in addition to conventional measures prepared in accordance with IFRS, certain investors use this information to evaluate our performance. The data presented is intended to provide additional information and should not be considered in isolation or as a substitute for measures of performance prepared in accordance with IFRS. Readers should also refer to our management’s discussion and analysis, available under our corporate profile on SEDAR+ at www.sedarplus.com for a more detailed discussion of how we calculate such measures.
All-in Sustaining Costs
The Company, in conjunction with an initiative undertaken within the gold mining industry, has adopted AISC and all-in sustaining cost measures based on guidance published by World Gold Council ("WGC"). The Company conforms its AISC and all-in cash cost definitions to that set out in the guidance and the Company has presented the cash cost figures on a sold ounce basis. We define All-in Sustaining Costs as total production cash costs incurred at the applicable mining operation but excludes mining royalty recognized as income tax within the scope of IAS12, as well as non-sustaining capital expenditures. Sustaining capital expenditures, corporate selling, general and administrative expenses, gains from blue-chip swaps and brownfield exploration expenditures are added to the cash cost. AISC is estimated at realized metal prices.
Cash Costs
Cash costs include all direct and indirect operating cash costs related directly to the physical activities of producing metals, including mining and processing costs, third-party refining and treatment charges, on-site general and administrative expenses, applicable production taxes and royalties which are not based on sales or taxable income calculations , net of by-product credits, but are exclusive of the impact of noncash items that are included as part of the cost of sales that is calculated in the consolidated Income Statement including depreciation and depletion, reclamation, capital, development and exploration costs.
Management believes that cash cost and AISC measures provide useful information regarding the Company's ability to generate operating earnings and cash flows from its mining operations and uses such measures to monitor the performance of the Company's mining operations. In addition, the Company believes that each measure provides useful information to investors in comparing, on a mine-by-mine basis, our operations relative performance on a period-by-period basis, against our competitors’ operations.
EBITDA
EBITDA is a non-IFRS measure which is calculated as net income before interest, taxes, depreciation, and amortization, and is an alternate measure of profitability to net income. Management believes it is used by investors and analysts as useful indicators of assessing a company's profitability and financial performance.
A PDF accompanying this announcement is available at
http://ml.globenewswire.com/Resource/Download/43964bae-d86e-4b4c-969d-aeecbe96ba90
Photos accompanying this announcement are available at
https://www.globenewswire.com/NewsRoom/AttachmentNg/9589b113-cb55-43d0-9ac9-174ef0054c03
https://www.globenewswire.com/NewsRoom/AttachmentNg/4d5ef3de-abb6-403a-bcad-fd5b8cff58d8
https://www.globenewswire.com/NewsRoom/AttachmentNg/1bbf3837-15bf-4d58-ac1a-45f4d9d35205
https://www.globenewswire.com/NewsRoom/AttachmentNg/9ae0cf9e-fff3-4b3b-880b-3c04959d57c0
https://www.globenewswire.com/NewsRoom/AttachmentNg/07e87de9-33e4-4694-a76c-22569b08f499

![]()
Figure 1
Diamba Sud PEA Production Profile: Annual gold production profile over the projected LOM, highlighting the contribution from individual deposits and the transition from oxide to fresh material.
Figure 2

Diamba Sud Cash Flow Profile
Figure 3

After-tax NPV5% Sensitivities
Figure 4
Diamba Sud Post-Tax IRR sensitivities
Figure 5
Diamba Sud Projected Development Timeline and Key Milestones
Legal Disclaimer:
EIN Presswire provides this news content "as is" without warranty of any kind. We do not accept any responsibility or liability for the accuracy, content, images, videos, licenses, completeness, legality, or reliability of the information contained in this article. If you have any complaints or copyright issues related to this article, kindly contact the author above.
